
Reconcile community, genetic and functional evidence before telling a causal story
A complete microbial inference must connect quantities without erasing how each was obtained. An image object, recoverable unit, sequence read, marker carrier, expression proxy and carbon flux are not automatically the same unit. The final comparison combines community composition, observation bias, genetic state and function, while keeping actual source microscopy separate from the original numerical records.
Learning outcome: Reconstruct the true and observed records separately, then vary recovery without changing biology. Keep expression and carbon currencies distinct and propose a source-aware additional observation needed before a causal host or control claim.
Starting recap
Defend a source-aware whole-course inference with distinct observation, genetic, metabolic, host and control boundaries; preserve actual source actions, first reasoning and unmet independent/practical gates.
All lessons are open directly. Your saved experiments remain when you leave and return.
Try
At r=0.25, e=2, recovered A100/B300 give observed marker fraction 0.25 despite true 0.4. Independent expression 800 is 0.8 per true population unit but 2 per recovered unit. Applying carbon weights to recovered counts gives 500 rather than true 1400; correcting A100/0.25 and B300/0.5 restores 1400.
Open the experimentPredict
Which claimed changes disappear once the observation denominator is restored?
Experiment
Reconstruct the true and observed records separately, then vary recovery without changing biology. Keep expression and carbon currencies distinct and propose a source-aware additional observation needed before a causal host or control claim.
Reconcile community, marker, expression and carbon currencies
Worked teaching model · synthetic values · Original true A 400/B 600 units. A recovery variable, B recovery 0.5. Marker only in A; expression b per A measured independently of recovery. Carbon uptake separately stipulated 2 units per A and 1 per B. No actual organisms, causal host effect or process conditions.
Reset keeps your prediction, captures and practice history.
Recovery, carrier frequency, expression and community function must retain their own denominators before a causal story is proposed.
Original true A 400/B 600 units. A recovery variable, B recovery 0.5. Marker only in A; expression b per A measured independently of recovery. Carbon uptake separately stipulated 2 units per A and 1 per B. No actual organisms, causal host effect or process conditions.
| Quantity | Value | Unit |
|---|---|---|
| Observed A units | 100 | expected recovered units |
| Observed B units | 300 | expected recovered units |
| Observed marker-bearing fraction | 0.2500000 | fraction |
| True marker-bearing fraction | 0.4000000 | fraction |
| Independently measured total expression | 800 | proxy units |
| Expression per true population unit | 0.8000000 | proxy/unit |
| Expression per recovered unit if denominators mixed | 2 | proxy/recovered unit |
| Independent carbon uptake | 1400 | carbon units |
| Carbon uptake falsely predicted from recovered counts | 500 | carbon units |
| Recovery-corrected carbon uptake | 1400 | carbon units |
These fictional records do not supply actual organisms, clinical observations, biological procedures or completed learner evidence. The separate source-labeled micrographs retain their own provenance and limitations.
Recovery, carrier frequency, expression and community function must retain their own denominators before a causal story is proposed.
Original true A 400/B 600 units. A recovery variable, B recovery 0.5. Marker only in A; expression b per A measured independently of recovery. Carbon uptake separately stipulated 2 units per A and 1 per B. No actual organisms, causal host effect or process conditions.
Captures preserve recipes and replay their calculated results. They are synthetic model evidence, not physical measurements.
Understand
Connect the whole-course evidence
A complete microbial inference must connect quantities without erasing how each was obtained. An image object, recoverable unit, sequence read, marker carrier, expression proxy and carbon flux are not automatically the same unit. The final comparison combines community composition, observation bias, genetic state and function, while keeping actual source microscopy separate from the original numerical records.
The fictional true population contains A400 and B600 units. Only A carries an abstract marker. A recovery is r and B recovery 0.5, so observed counts are 400r and 300. Expression is independently measured as e proxy units per true A unit, yielding 400e. A separate documented carbon budget assigns uptake 2 per A and 1 per B, total 1400 carbon units. These assigned rates are not actual organism properties or an operating recommendation.
The observed marker-bearing fraction is 400r/(400r+300), not necessarily the true 0.4. Dividing independent expression by recovered rather than true population size mixes measurement boundaries. Applying true per-unit carbon contributions to incomplete recovered counts similarly underestimates the declared total; an inverse correction works here only because both recovery factors are independently supplied.
Before extending the story to host harm or useful control, require a defined phenotype, source frame, time order and competing causal explanations. A genetic marker is not proof of expression; expression is not automatically function; function is not automatically disease or safety. The original actual yeast/Paramecium images support visible morphology and provenance actions, not independent identification, physical scale or causal evidence for this unrelated numerical packet.
Reconstruct separate boundaries
At r=0.25, e=2, recovered A100/B300 give observed marker fraction 0.25 despite true 0.4. Independent expression 800 is 0.8 per true population unit but 2 per recovered unit. Applying carbon weights to recovered counts gives 500 rather than true 1400; correcting A100/0.25 and B300/0.5 restores 1400.
Predict and investigate
Predict first: Which claimed changes disappear once the observation denominator is restored?
Reconstruct the true and observed records separately, then vary recovery without changing biology. Keep expression and carbon currencies distinct and propose a source-aware additional observation needed before a causal host or control claim.
Defend a changed case
Apply the mechanism to a changed boundary
Use r=0.75, e=3. Find recovered marker fraction, expression per true versus recovered unit and the naive carbon total.
Retain the first response, units, uncertainty and any prior feedback exposure in the notebook before comparing this public explanation.
Compare a worked response
Recovered counts 300/300 give marker fraction 0.5. Expression 1200 is 1.2 per true unit but 2 per recovered unit. Naive carbon is 2×300+300=900; independently corrected carbon remains 1400. Changing measurement can alter inferred composition without changing the true 0.4.
Actual source audit, not synthetic substitution
Actual images: provenance is not independent identification
Inspect visible features, record an alternative and identify what remains unresolved. Source names and descriptions below are disclosed guided information; preserve that exposure. Neither image supplies an embedded calibrated size for these exercises.
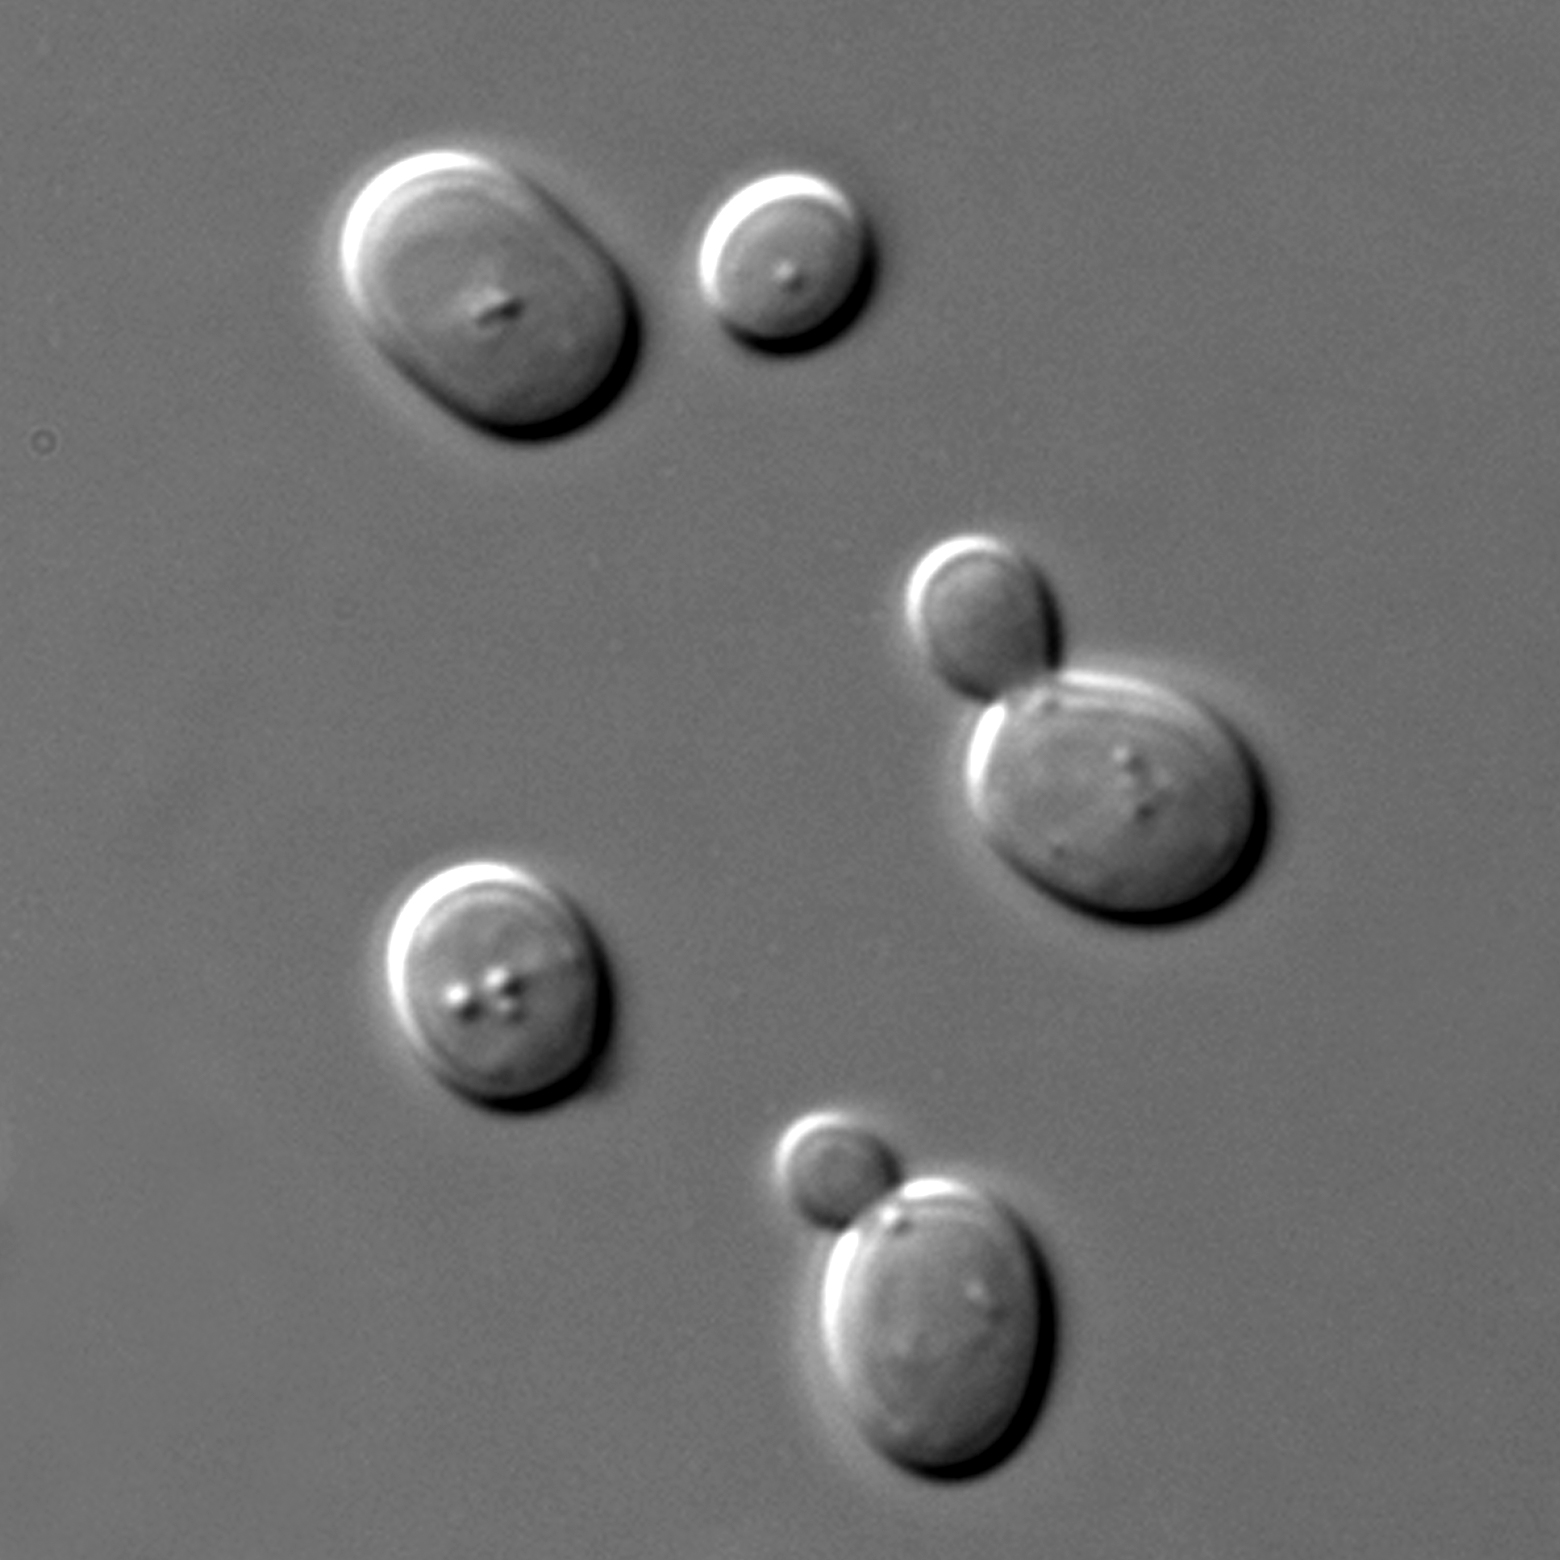
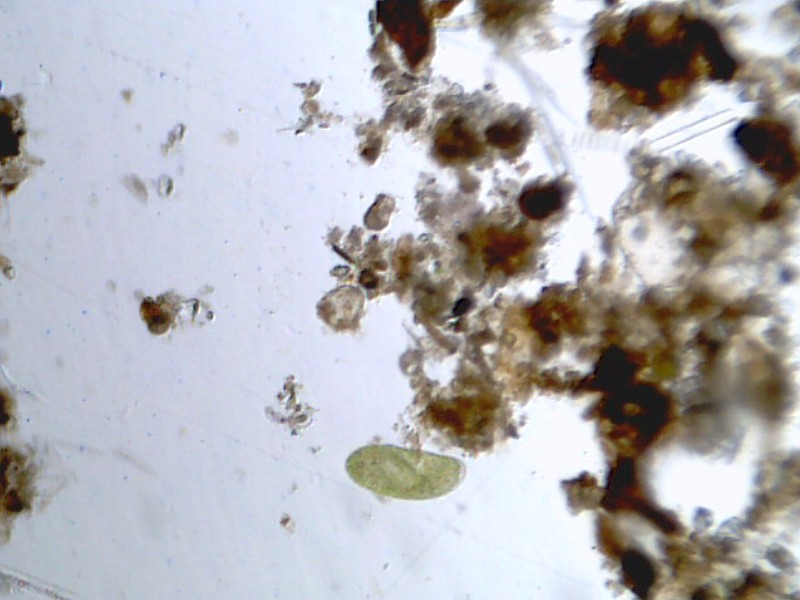
Download image provenance, source links and SHA-256 hashes. The original source files can be opened separately; no collection, culturing or unknown-organism handling is needed.
Retain the evidence chain
Complete the versioned Microbiology evidence workspace stages with original plans, source/version/reuse, first reports and actual human critique. Prior category projects remain archived. No physical culture, clinical test, resistance generation or biological handling is requested. Public feedback and supplied source labels must be declared; actual independent learner/practical competence is not fabricated.
Primary evidence context, checked 31 October 2026. Original synthesis records, not actual clinical or community measurements.
Apply
Public practice checks a specific claim. It does not establish independent mastery.
Use r=0.75, e=3. Find recovered marker fraction, expression per true versus recovered unit and the naive carbon total.
Continue
Completion requires a saved prediction, at least one capture and a reflection. Presence checks do not grade your reasoning.
Skipping retains experiments and awards no mastery.
Save a science backup or import one
Science work is stored locally in this browser, separately from mathematics and AI. It does not sync automatically. Use this science-only backup; this checkout's older all-subject export does not include science.
A legacy file is available only when the complete snapshot fits the 36 MB limit. For larger snapshots, prepare a complete file set below; never discard notebooks to make a smaller file.
Matching imported notebook drafts replace their current drafts. Omitted lessons and known first attempts remain. Export your current work first if you want to retain both drafts.
Complete file sets and course backups
A file set can hold more work than one science file. Keep its manifest and every part together. Each file is limited to 36 MB. This format needs this version of LearnAI or a compatible newer version; older versions can use only the legacy single-file backup above.
The set includes every saved science course and global continuation at this moment. Later edits need a new export. A conflicting tab exports its own visible work, which may differ from saved work in another tab.
0 file(s) selected. File order and filenames do not determine identity. Missing, changed or conflicting parts block the entire restore; no good part is applied by itself.
Science storage: loading. No account or remote computation is required.