
Design an accessible comparison using source-labeled lunar renderings
The source packet contains five unchanged NASA Scientific Visualization Studio frames at 00 UT on 1,8,15,22 and 29 January 2026, selected at a fixed seven-day cadence. These are scientific renderings based on lunar terrain/mosaic inputs and an ephemeris, not photographs exposed at those dates. Their provenance is useful evidence precisely because it identifies how the images and numbers were generated.
Learning outcome: Download the original JSON, selected CSV and provenance. Verify a timestamp/frame and all fields for one record, then compare two unchanged images and their diameter/distance ratios. Retain a changed-pair prediction and explain why agreement among derived source fields is not independent observational confirmation.
Starting recap
Keep celestial and local frames, solar and sidereal time, phase and eclipse geometry, and source rendering versus direct observation distinct.
All lessons are open directly. Your saved experiments remain when you leave and return.
Try
The 1 January record has 91.40% illumination, diameter 1985.1 arcsec and distance 361045 km. The 15 January record has 13.49%,1770.9 arcsec and 404728 km. The illumination change is−77.91 percentage points; the smaller angular diameter is consistent with the larger geocentric distance. These are source-model records, not independent sky measurements.
Open the experimentPredict
Would resizing every lunar disk to the same diameter preserve an apparent-size comparison?
Experiment
Download the original JSON, selected CSV and provenance. Verify a timestamp/frame and all fields for one record, then compare two unchanged images and their diameter/distance ratios. Retain a changed-pair prediction and explain why agreement among derived source fields is not independent observational confirmation.
Audit two NASA scientific-rendering frames with their ephemeris records
Worked teaching model · synthetic values · Source NASA SVS 5587: geocentric scientific renderings and ephemeris-derived records at 00 UT January 1,8,15,22,29 2026. Frames 1,169,337,505,673; images are not direct photographs at these times. Compare illuminated percentage and apparent diameter while preserving source orientation, distance and common display scale. No local visibility inference from geocentric coordinates.
Reset keeps your prediction, captures and practice history.
A source-labeled rendering can support an image-comparison task without pretending to be an independent photograph.
Frame geometry comes from source ephemerides and LRO-based rendering. Distance and angular diameter are related, so their agreement is an internal check, not independent validation of the ephemeris. Keep published rounding, north-up orientation and raw image bytes; pixel brightness is not illuminated area.
Archived source frames, not photographs at these times
These unchanged NASA Scientific Visualization Studio frames use LRO-based terrain/mosaic rendering and an ephemeris. They are not direct exposures taken at the displayed times. Both 730-pixel source canvases are displayed at equal width; no independent resizing of their lunar disks is applied.
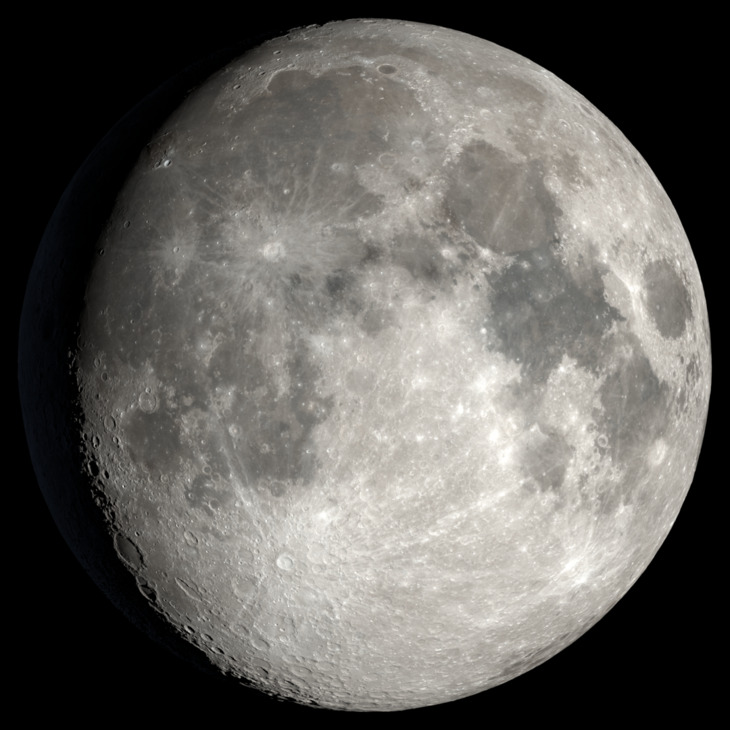
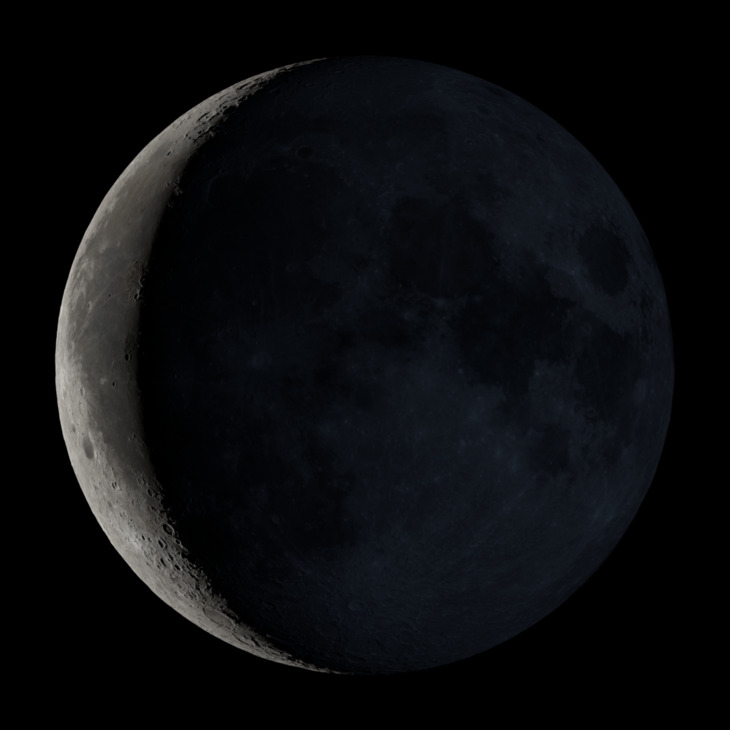
| Time | Frame | Illuminated % | Diameter arcsec | Distance km | J2000 RA hours | J2000 Dec degrees |
|---|---|---|---|---|---|---|
| 01 Jan 2026 00:00 UT | 1 | 91.4 | 1985.1 | 361045 | 4.2348 | 26.3373 |
| 08 Jan 2026 00:00 UT | 169 | 75.5 | 1858.8 | 385589 | 11.1745 | 4.6431 |
| 15 Jan 2026 00:00 UT | 337 | 13.49 | 1770.9 | 404728 | 16.6292 | -27.2631 |
| 22 Jan 2026 00:00 UT | 505 | 10.31 | 1862.1 | 384906 | 22.7039 | -8.2128 |
| 29 Jan 2026 00:00 UT | 673 | 80.22 | 1956.4 | 366344 | 4.9429 | 27.8315 |
Original full source JSON · Five selected records CSV · Selection, file hashes and reuse provenance
Full source JSON SHA-256: 098ec6434ba4fecb84e66485385816d465b7969f142864bcfc9ffc68311b4a86
Source media: NASA Scientific Visualization Studio, product 5587; visualizer Ernie Wright (USRA), planetary scientist Noah Petro (NASA/GSFC), producer James Tralie (eMITS). Source inputs include LRO LOLA, LROC/Arizona State University and JPL DE421. Used factually under NASA media guidelines, with no endorsement. No separate third-party restriction is marked on these selected frames. Original course explanations/models are AI-assisted, not NASA-authored or NASA-reviewed; NASA is not responsible for their accuracy.
Retain the timestamp, frame number, raw values and orientation before comparing. Published percentages are projected illuminated area, not a sum of pixel brightness. The geocentric reference does not establish local altitude, weather or visibility. This source-image pathway requires no outdoor or solar viewing.
First source record: 01 Jan 2026 00:00 UT; frame 1
Second source record: 15 Jan 2026 00:00 UT; frame 337
| Quantity | Value | Unit |
|---|---|---|
| First illuminated fraction | 0.9140000 | fraction |
| Second illuminated fraction | 0.1349000 | fraction |
| Illumination change | -77.91000 | percentage points |
| Second/first apparent diameter | 0.8920961 | ratio |
| First/second geocentric distance | 0.8920683 | ratio |
| Elapsed selected interval | 14 | days, signed |
Use the supplied screen-based records and diagrams. No direct Sun viewing, instrument aiming or outdoor observation is required or requested.
A source-labeled rendering can support an image-comparison task without pretending to be an independent photograph.
Frame geometry comes from source ephemerides and LRO-based rendering. Distance and angular diameter are related, so their agreement is an internal check, not independent validation of the ephemeris. Keep published rounding, north-up orientation and raw image bytes; pixel brightness is not illuminated area.
Captures preserve recipes and replay their calculated results. They are synthetic model evidence, not physical measurements.
Understand
Apply
Public practice checks a specific claim. It does not establish independent mastery.
Compare 22 January with 29 January. What changes in illumination and distance, and what must not be claimed?
Continue
Completion requires a saved prediction, at least one capture and a reflection. Presence checks do not grade your reasoning.
Skipping retains experiments and awards no mastery.
Save a science backup or import one
Science work is stored locally in this browser, separately from mathematics and AI. It does not sync automatically. Use this science-only backup; this checkout's older all-subject export does not include science.
A legacy file is available only when the complete snapshot fits the 36 MB limit. For larger snapshots, prepare a complete file set below; never discard notebooks to make a smaller file.
Matching imported notebook drafts replace their current drafts. Omitted lessons and known first attempts remain. Export your current work first if you want to retain both drafts.
Complete file sets and course backups
A file set can hold more work than one science file. Keep its manifest and every part together. Each file is limited to 36 MB. This format needs this version of LearnAI or a compatible newer version; older versions can use only the legacy single-file backup above.
The set includes every saved science course and global continuation at this moment. Later edits need a new export. A conflicting tab exports its own visible work, which may differ from saved work in another tab.
0 file(s) selected. File order and filenames do not determine identity. Missing, changed or conflicting parts block the entire restore; no good part is applied by itself.
Science storage: loading. No account or remote computation is required.